Science
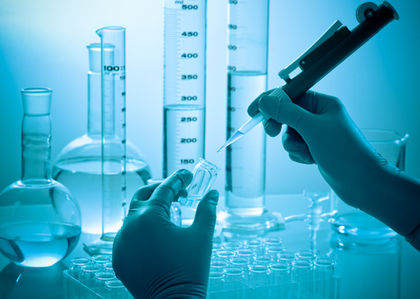
Scientists collect samples of air, water, soil, plants, and tissue to detect and monitor pollution. Pollutants are most often extracted from samples, then isolated by a technique called chromatography and analyzed by appropriate detection methods. Many pollutants are identified by their spectral fingerprints, unique patterns of absorbed or emitted radiation in the ultraviolet (UV), visible, or infrared (IR) region of the electromagnetic spectrum . Biomonitoring and technologies including satellite observation, sidescan sonar, and bioluminescent reporter chips are also used for pollution monitoring. In the United States, the U.S. Environmental Protection Agency (EPA) approves the methods for monitoring regulated pollutants such as pesticide residues and those in air and drinking water.
Sampling and Extraction
Air can be actively or passively sampled. Actively sampled air is pumped through a filter or chemical solution. For example, airborne lead, mostly originating from metals processing plants, is collected on filters by active sampling and then analyzed spectroscopically. Air that is not pumped but allowed to flow or diffuse naturally is passively sampled. Nitrogen oxides, resulting from vehicle emissions and combustion, can be monitored in passive sampling tubes by their reaction with triethanolamine to form nitrates. The tubes are taken to a laboratory and the amount of nitrate analyzed.
Liquid or solid extraction removes a mix of pollutants from samples. In liquid extraction, samples are shaken with a solvent that dissolves the pollutants. Solid extraction involves the adherence or absorption of pollutants to a solid that is then heated to release a mix of vaporized pollutants which are subsequently analyzed.
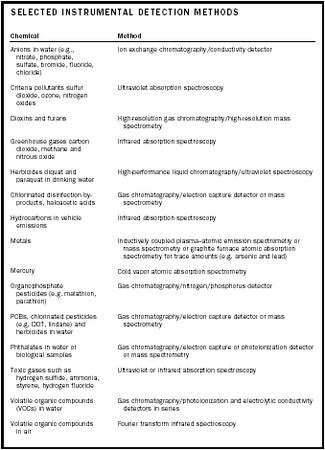
| Chemical | Method |
| Anions in water (e.g., nitrate, phosphate, sulfate, bromide, fluoride, chloride) | Ion exchange chromatography/conductivity detector |
| Criteria pollutants sulfur dioxide, ozone, nitrogen oxides | Ultraviolet absorption spectroscopy |
| Dioxins and furans | High-resolution gas chromatography/high-resolution mass spectrometry |
| Greenhouse gases carbon dioxide, methane and nitrous oxide | Infrared absorption spectroscopy |
| Herbicides diquat and paraquat in drinking water | High-performance liquid chromatography/ultraviolet spectroscopy |
| Chlorinated disinfection by-products, haloacetic acids | Gas chromatography/electron capture detector or mass spectrometry |
| Hydrocarbons in vehicle emissions | Infrared absorption spectroscopy |
| Metals | Inductively coupled plasma–atomic emission spectrometry or mass spectrometry or graphite furnace atomic absorption spectrometry for trace amounts (e.g. arsenic and lead) |
| Mercury | Cold vapor atomic absorption spectrometry |
| Organophosphate pesticides (e.g. malathion, parathion) | Gas chromatography/nitrogen/phosphorus detector |
| PCBs, chlorinated pesticides (e.g. DDT, lindane) and herbicides in water | Gas chromatography/electron capture detector or mass spectrometry |
| Phthalates in water or biological samples | Gas chromatography/electron capture or photoionization detector or mass spectrometry |
| Toxic gases such as hydrogen sulfide, ammonia, styrene, hydrogen fluoride | Ultraviolet or infrared absorption spectroscopy |
| Volatile organic compounds (VOCs) in water | Gas chromatography/photoionization and electrolytic conductivity detectors in series |
| Volatile organic compounds in air | Fourier transform infrared spectroscopy |
Chromatography
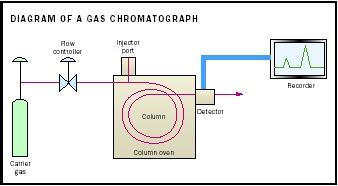
Chromatography is the method most often used in environmental chemistry to separate individual pollutants from mixtures. The mixture to be analyzed is added to a liquid or gas, depending on whether liquid or gas chromatography is employed. The liquid or gas, called the mobile phase, is then forced through a stationary phase, often a column packed with solid material that can be coated with a liquid. The stationary and mobile phases are chosen so that the pollutants in the mixture will have different solubilities in each of them. The greater the affinity of a pollutant for the stationary phase, the longer it will take to move through the column. This difference in the migration rate causes pollutants to separate.
A chromatogram is a graph of intensity peaks that are responses to a detection method, indicating the presence of a pollutant, plotted against time.
Different kinds of chromatography work best for different pollutants. Gas chromatography separates organic chemicals that vaporize easily (VOCs). Benzene and ethylbenzene are VOCs in vehicle exhaust and are monitored in drinking water. Many pesticides, polychlorinated biphenyls (PCBs), and dioxin are separated by gas chromatography. Less volatile substances such as the herbicide diquat are isolated by high-performance liquid chromatography (HPLC). Ion exchange chromatography separates inorganic ions such as nitrates that can pollute water when excess fertilizer or leaking septic tanks wash into it.
Detectors
Chromatographic methods are routinely automated. A detector that responds to the pollutants' physical or chemical properties analyzes the gas or liquid leaving the column. Detectors can be specific for individual pollutants or classes of pollutants, or nonspecific.
Nonspecific Detectors. Flame ionization, thermal conductivity, and mass spectrometry are common nonspecific detection methods that detect all molecules containing carbon and hydrogen. In mass spectrometry, molecules of a gas are energized in a variety of ways, such as bombardment with electrons or rapid heating, causing them to gain or lose electrons. Because they have different masses and charges, the resulting ions are separated when they pass through magnetic and electric fields. The size and distribution of peaks for ions with different mass-to-charge ratios, known as the mass spectrum, identify the gas and determine its concentration. Gas chromatography coupled with high-resolution mass spectrometry definitively identifies PCBs and is the most accurate way to determine their concentration. Portable gas chromatograph/mass spectrometers can measure VOCs in soil and water to parts per billion (ppb).
Specific Detectors. Methods that detect classes of pollutants include nitrogen/phosphorous detectors for organophosphate pesticides, thermionic ionization detectors that detect molecules containing NO 2 , nitro groups, such as dinitrotoluene and electron capture. Electron capture is particularly sensitive to compounds, such as organohalide pesticides that contain the halogen atoms, chlorine, bromine, or fluorine. These atoms strongly attract electrons. The electron capture detector emits electrons that are captured by the halogens atom. The reduction in electric current corresponds to the concentration of pollutant. Chlorinated disinfection by-products, haloacetic acid, and phthalates in drinking water can be separated by gas chromatography and measured by electron capture. Sulfur hexafluoride, an ozone-depleting gas, can be measured to parts per trillion (ppt) by electron capture. Spectroscopic detection methods including IR, UV, and atomic absorption and emission spectroscopy are unique for specific compounds.
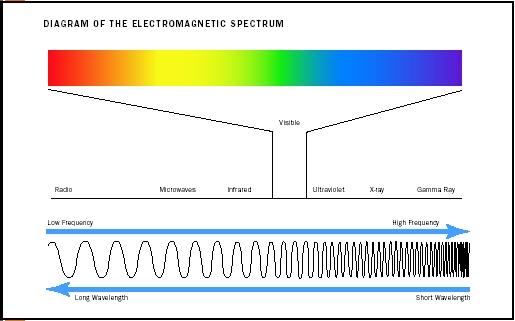
Spectroscopic Detection. The electromagnetic spectrum encompasses all forms of electromagnetic radiation from the most energetic cosmic and gamma rays to the least energetic radio waves. The part of the spectrum that is particularly useful in identifying and measuring pollutants consists of radiation that interacts with the atoms and molecules that make up life on Earth. This includes radiation in the UV, visible, and IR regions.
Atomic Spectra. Atoms of different elements may be thought of as having different arrangements of electrons around the nucleus in increasing energy levels. When metals such as lead, copper, and cadmium are vaporized at high temperatures, some electrons jump to higher energy levels. When the electrons drop to their original levels, the metal atoms emit radiation in a range of wavelengths from IR to UV, including visible light. The colors in fireworks result from such emissions. The wavelengths emitted constitute a unique "fingerprint" for each element and their intensity reflects the metal concentration. Inductively coupled plasma emission spectra (ICP–AES), in which a high-temperature gas or plasma excites metal atoms, are used to identify and quantify heavy metal contamination.
The same spectral fingerprint is obtained from the wavelengths of light that each element absorbs. Trace amounts of certain metals such as mercury and arsenic are more accurately measured from their absorption, rather than their emission spectra.
UV and IR Spectra. Many pollutants can be identified by their UV and IR spectra because all molecules that absorb strongly at specific wavelengths exhibit spectral fingerprints. Pollutants separated by liquid chromatography are often detected by spectroscopy. Gases such as those from vehicle emissions, landfills, industrial manufacturing plants, electric power plants, and hazardous incineration smokestacks can be monitored by spectroscopic methods. Gas and chemical leaks may also be monitored by spectroscopy.
UV Absorption Spectra. Toxic gases such as hydrogen sulfide, ammonia, and styrene can be monitored by their UV absorption spectra. Open path monitors emit UV radiation from a source, such as a bulb containing excited xenon gas, across the area to be monitored. Detectors record the absorbed wavelengths to produce a spectral fingerprint for each gas. Ammonia is often used as a coolant for turbine generators in power plants. It can be monitored for worker safety by its UV spectrum. The EPA has established National Ambient Air Quality standards for the six criteria pollutants: carbon monoxide, lead, nitrogen dioxide, ozone, particulate matter, and sulfur dioxide.
Satellite instruments monitoring stratospheric ozone generally measure the decrease in intensity in UV solar radiation due to ozone absorption. The total ozone mapping spectrometer on the Earth probe satellite (TOMS/EP) scans back and forth beneath the satellite to detect six individual frequencies of UV light that are scattered by air molecules back through the stratosphere. The more ozone in the stratosphere, the more "backscattered" UV radiation will be absorbed compared to UV radiation directly from the sun.
Some IR open path monitors use a tunable diode laser source in the near IR. The laser emits the specific frequency at which a monitored gas absorbs, so there is no interference from other gases or particles such as rain or snow. Such lasers are widely employed in the telecommunications industry. Pollutants that absorb at specific wavelengths in this range include hydrogen fluoride, an extremely toxic gas used in the aluminum smelting and petroleum industries. Hydrogen fluoride can be monitored to one part per million (ppm) for worker safety by this method.
The greenhouse gases carbon dioxide, nitrous oxide, and methane may also be monitored by IR spectroscopy. Currently, emissions of carbon dioxide from power plants are not generally measured directly but are estimated. However, the amount of carbon dioxide in the atmosphere over Mauna Loa has been measured continuously by IR spectroscopy since 1958. The Mauna Loa Observatory is located on the earth's largest active volcano on the island of Hawaii. It is relatively remote from human activity and changes in carbon dioxide concentration above it are considered a reliable indicator of the trend of carbon dioxide concentration in the troposphere. Data from Mauna Loa show a 17.4 percent increase in carbon dioxide concentration from 315.98 parts per million (ppm) by volume of dry air in 1959 to 370.9 ppm in 2001.
Remote sensors for vehicle emissions contain units that detect and measure carbon monoxide, carbon dioxide, and hydrocarbons by their IR spectra. Because IR absorption bands from water and other gases found in car exhaust interfere with the IR spectrum of NO x , the sensor also contains a unit that measures NO x from their UV absorption spectra.
Fourier transform IR spectroscopy (FTIR) analyzes the absorption spectrum of a gas mixture to detect as many as twenty gases simultaneously. The technique involves analyzing the spectra mathematically and then comparing the observed fingerprints with calibrated reference spectra stored on the hard drive of the computer to be used for analysis. Reference spectra for more than one hundred compounds are stored, including most of the VOCs considered hazardous by the EPA. Instruments that use UV Fourier transform analysis are now available. The instruments are generally installed at one location, but are portable and can be battery operated for short-term surveys. Multiple gas-monitoring systems are used in a variety of industries, including oil and gas, petrochemical, pulp and paper, food and beverage, public utility, municipal waste, and heavy industrial manufacturing.
Biomonitoring
Biomonitoring is the study of plants, vertebrate, and invertebrate species to detect and monitor pollution. Moss and lichens absorb heavy metals, mainly from air, and have been analyzed by scientists studying air pollution.
Water pollution can be studied by recording changes in the number and type of species present and in specific biochemical or genetic changes in individual organisms. Blue mussels accumulate metals in certain tissues over time and are monitored in the United States and international waters for changes in pollution levels. The index of biotic integrity (IBI), first developed by James Karr in 1981 to assess the health of small warmwater streams, uses fish sampling data to give a quantitative measure of pollution. Twelve indicators of stream health, appropriate to the geographical area, including the total number of fish, the diversity of species, and food chain interactions, are numerically rated with a maximum of five points each. An IBI close to sixty corresponds to a healthy stream, whereas a rating between twenty and twelve implies a considerable pollution. Versions of the IBI with appropriate indicators are used to assess rivers and streams in France, Canada, and different regions of the United States.
Bioluminescent Reporter Technology
In bioluminescent reporter technology, bacteria that break down pollutants are genetically modified to emit blue green light during the degradation process. The bacteria are embedded in a polymer porous to water and combined with a light sensor integrated with a silicon computer chip. The sensor measures the intensity of the glow to determine the amount of pollution, and that information is transmitted to a central computer.
Bioluminescent reporter technology is still being studied by researchers, but is currently employed in some wastewater treatment plants in the United Kingdom. Incoming wastewater is monitored for chemicals that inhibit the bacterial activity necessary for efficient wastewater treatment. The incoming water is automatically sampled and mixed with freeze-dried luminescent bacteria from the treatment plant. A reduction in light intensity compared to a control with pure water indicates the chemical inhibition of wastewater microorganisms. This technology is also being used to identify petroleum pollutants, such as napthelene.
Sidescan Sonar
Sidescan sonar instruments bounce sound off surfaces both vertically and at an angle to produce images of sea and riverbeds. Because PCBs tend to stick preferentially to organic matter, there is a greater possibility of finding them in small-grain aquatic sediments, since these contain more organic material. The EPA has analyzed sound reflection patterns from sidescan sonar data to identify areas of small grain size and selectively sample for PCBs in the Hudson River, New York. Sidescan sonars are also used to detect sea grass, an indicator of marine health, and sewage or oil leaks from underwater pipelines.
Regulations
Once a potentially harmful pollutant is measured in trace amounts, then regulators, such as the EPA, have to decide on a safe limit. Risk analysis is the method used to set limits on harmful pollutants in the United States. Risk is calculated based on laboratory tests, sometimes on animals, and epidemiological studies that relate human health to exposure.
Risk analysis is conducted for individual pollutants, but people can be exposed to multiple pollutants simultaneously, such as pesticides, heavy metals, dioxins, and PCBs. Even though a person's exposure to individual chemicals may fall within regulated limits, the pollutants may interact to cause as yet unknown adverse health effects. It is known, for instance, that exposure to both asbestos and tobacco smoke geometrically increases the risk of cancer. Because there are so many potentially harmful chemicals in the environment scientists cannot predict all their possible interactions and consequent health effects on the body.
SEE ALSO A IR P OLLUTION ; A RSENIC ; D IOXIN ; G REENHOUSE G ASES ; H EAVY M ETALS ; L EAD ; M ERCURY ; O ZONE ; PCBs (P OLYCHLORINATED B IPHENYLS) ; P ESTICIDES ; R ISK ; V EHICULAR P OLLUTION ; VOCs (V OLATILE O RGANIC C OMPOUNDS) ; W ATER T REATMENT .
Bibliography
Csuros, Maria. (1997). Environmental Sampling and Analysis Lab Manual. Boca Raton, FL: Lewis Publishers.
Manahan, Staley E. (2001). Fundamentals of Environmental Chemistry, 2nd edition. Boca Raton, FL: Lewis Publishers.
Schnelle, Kard B., Jr., and Brown, Charles A. (2002). Air Pollution Control Technology Handbook. Boca Raton, FL: CRC Press.
Internet Resources
Carbon Dioxide Information Analysis Center Web site. "Atmospheric Carbon Dioxide Record from Mauna Loa." Available from http://cdiac.esd.ornl.gov/trends/co2/sio-mlo.htm .
Goddard Space Flight Center Web site. "Ozone Measurements, TOMS on Earth Probe Satellite." Available from http://toms.gsfc.nasa.gov/eptoms .
University of Tennessee. Center for Environmental Biotechnology Web site. "Bioreporter Research Projects." Available from http://www.ceb.utk.edu .
U.S. Environmental Protection Agency, Office of Water. "Approved Methods for Inorganic Chemicals and Other Parameters." Available from http://www.epa.gov/safewater .
U.S. Environmental Protection Agency, Technology Transfer Network Emissions Measurement Center. "CFR Promulgated Test Methods." Available from http://www.epa.gov/ttn .
U.S. Geological Survey. National Environmental Methods Index Web site. Available from http://www.nemi.gov .
Patricia Hemminger
When New Jersey inventors John Mooney and Carl Keith invented the three-way catalytic converter in 1974, the Wall Street Journal called it a $20 million mistake. Industry estimates today credit the catalytic converter with preventing fifty million tons of carbon monoxide and fifty million tons each of hydrocarbons and nitrogen oxides from polluting the air worldwide. In addition, the use of catalytic converters required that lead be removed from gasoline.
Comment about this article, ask questions, or add new information about this topic: